CHOICEONE FINANCIAL SERVICES (COFS)·Q4 2025 Earnings Summary
ChoiceOne Financial Beats Q4 Estimates as Fentura Integration Powers 94% Earnings Growth
January 30, 2026 · by Fintool AI Agent
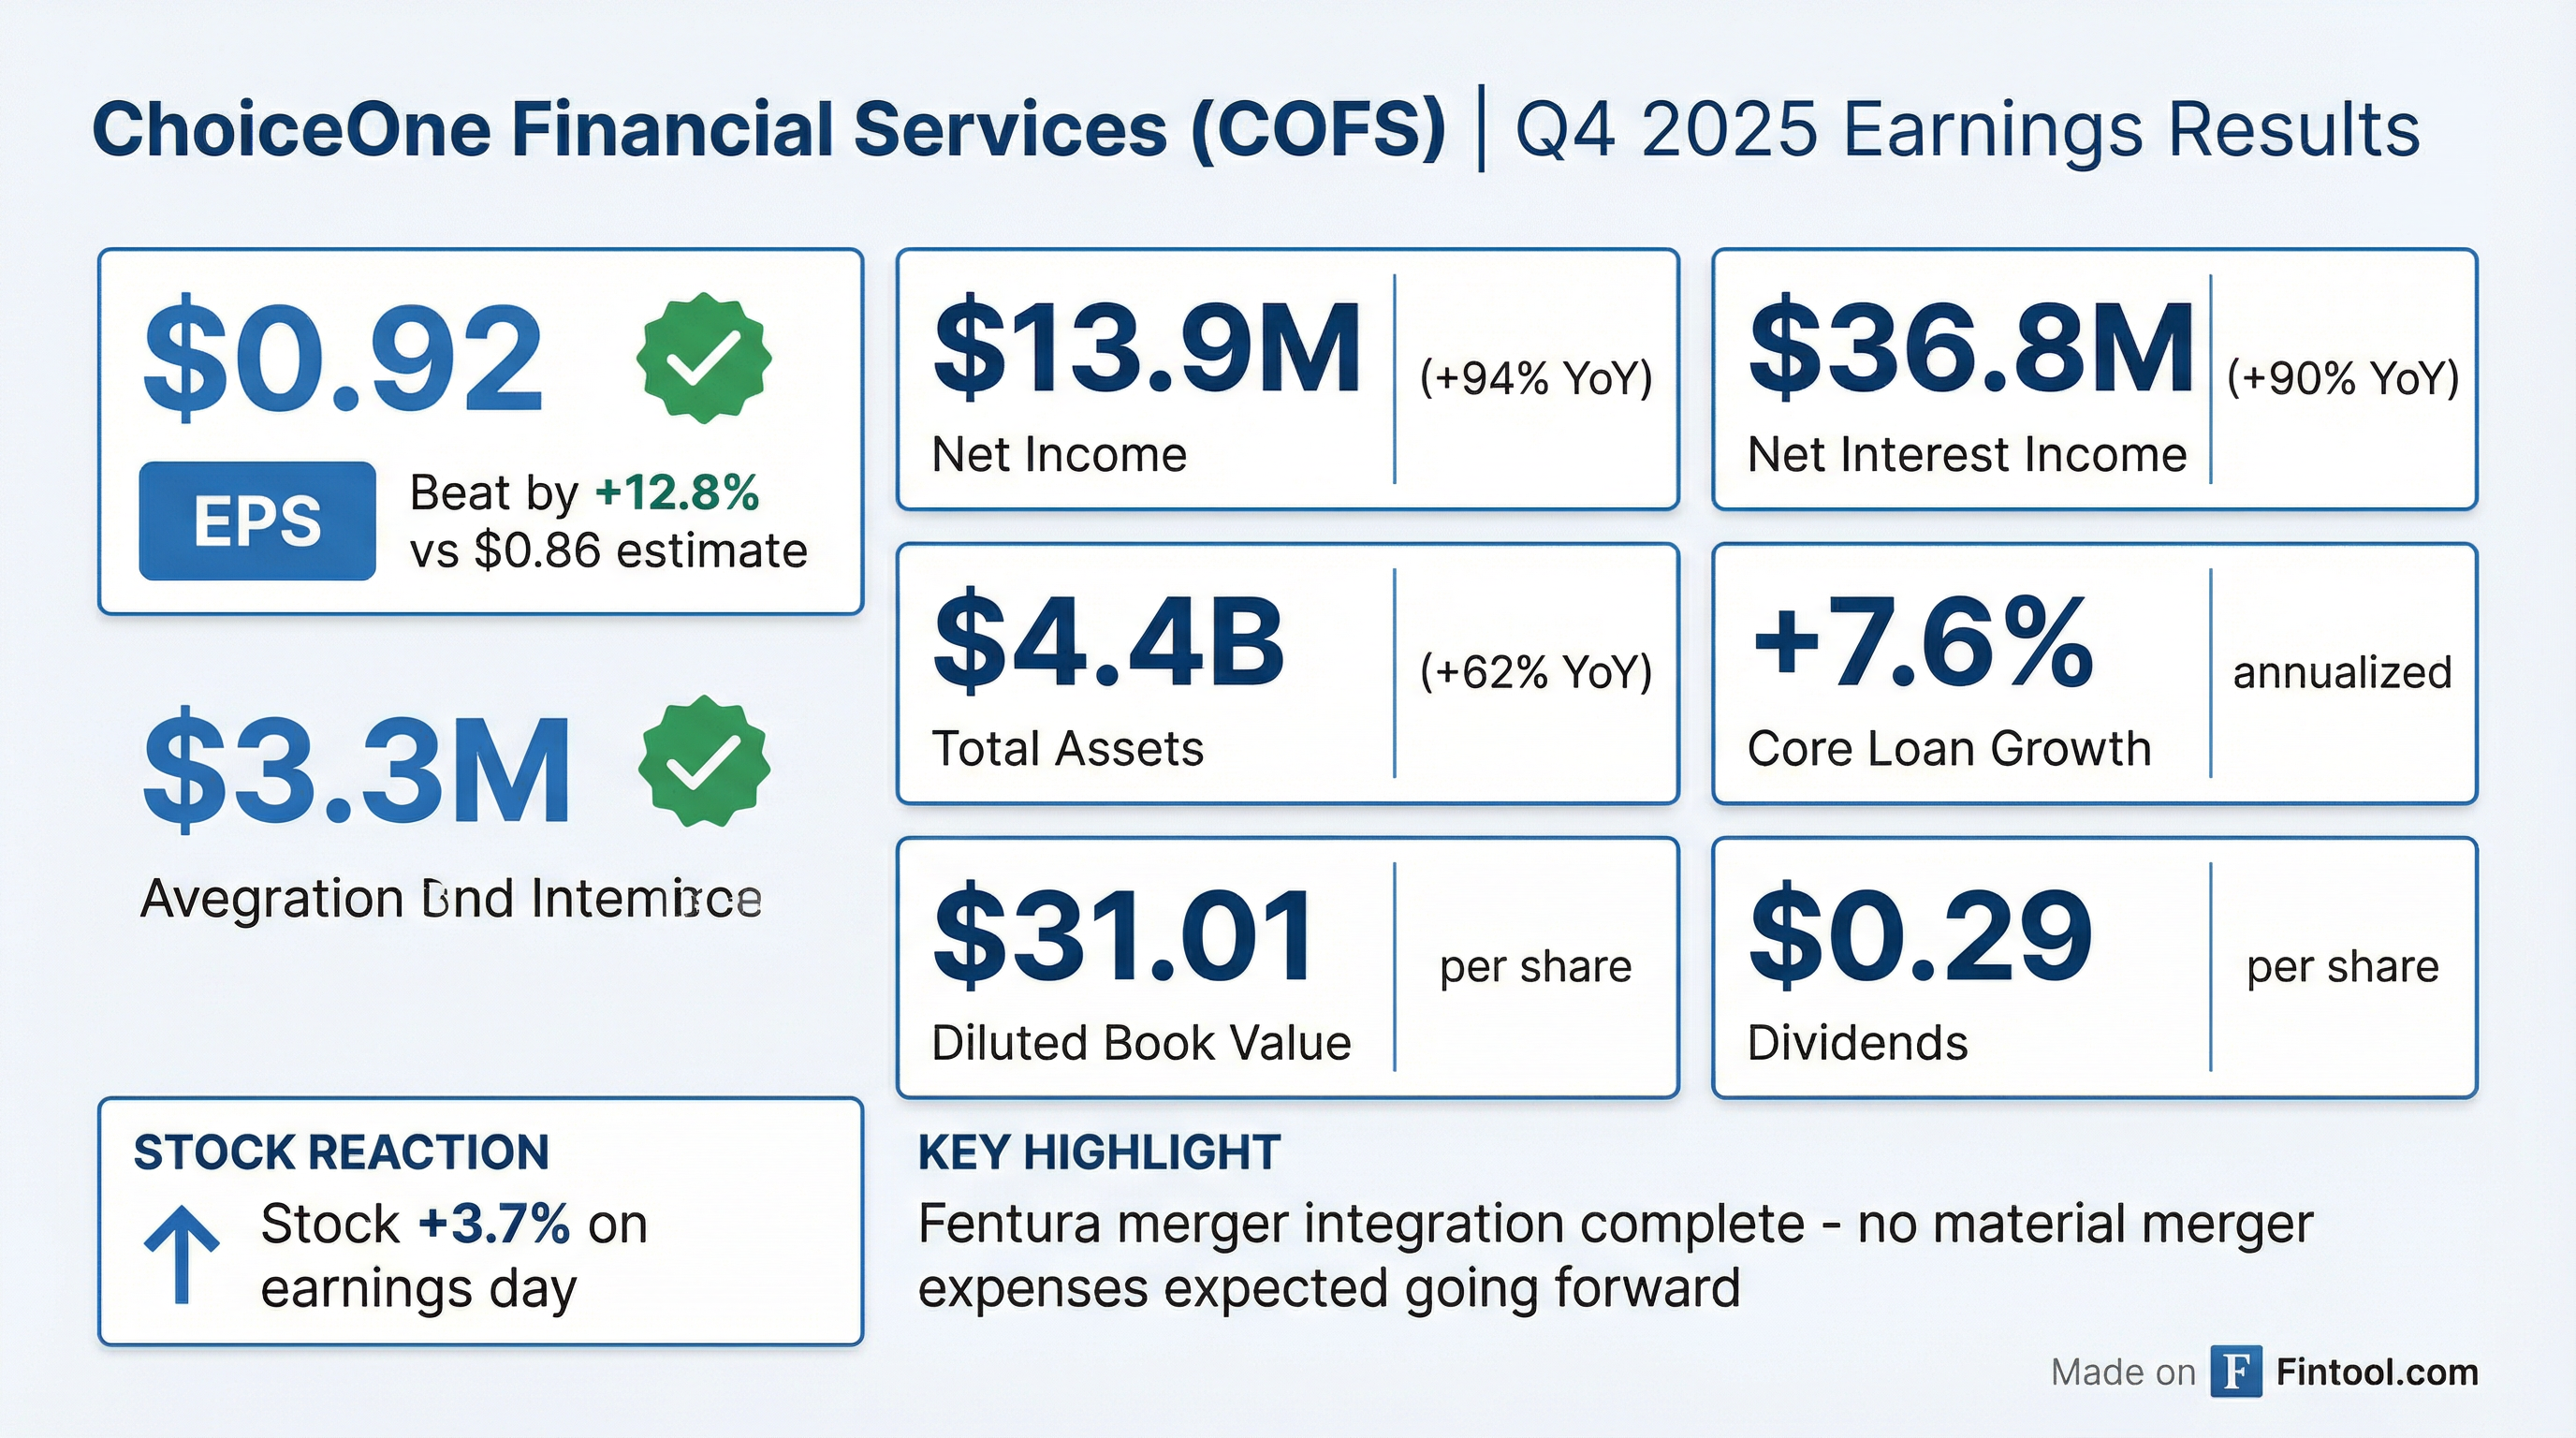
ChoiceOne Financial Services (NASDAQ: COFS) delivered a strong Q4 2025, reporting diluted EPS of $0.92 that beat consensus estimates of $0.86 by 12.8% . Net income nearly doubled year-over-year to $13.9M from $7.2M in Q4 2024, as the Michigan-based regional bank completed its integration of Fentura Financial with no material merger expenses remaining .
The quarter marks a clean inflection point for ChoiceOne. After absorbing $13.9M in merger-related expenses (net of taxes) through the first three quarters of 2025, the bank delivered a quarter with zero merger costs while demonstrating strong organic growth .
Did ChoiceOne Beat Earnings?
Yes — ChoiceOne beat on both EPS and revenue.
*Values retrieved from S&P Global
The beat was driven by stronger-than-expected net interest income, which rose 90% YoY to $36.8M, and continued organic loan growth despite the integration workload .
Beat/Miss History (Last 8 Quarters):
*Values retrieved from S&P Global
ChoiceOne has beaten EPS estimates in 7 of the last 8 quarters. The only miss (Q1 2025) coincided with the Fentura merger close and associated one-time provisions.
What Changed From Last Quarter?
The merger noise is over. Q4 2025 represents the first clean quarter since the Fentura merger closed on March 1, 2025 .
Key sequential changes:
-
NIM compression: Net interest margin declined 14 bps to 3.63% due to rate reductions on PRIME-linked loans and lower accretion income from purchased loans ($3.1M vs $3.6M in Q3)
-
Asset quality uptick: Nonperforming loans rose to 0.98% from 0.69%, but management emphasized 0.63% is attributable to pre-identified PCD loans from the acquisition — not new deterioration
-
Expense discipline: Noninterest expense declined $866K sequentially as merger-related costs fully rolled off
How Did the Stock React?
COFS +3.7% to $29.56 on the earnings release .
The stock has traded in a $24.89–$35.40 range over the past year. Today's close is just below the 50-day moving average of $29.91 and roughly in line with the 200-day average of $29.33.
Post-Merger Stock Performance:
- March 1, 2025 (merger close): ~$31.50
- Today: $29.56
- Performance since merger: -6.2%
The stock underperformed through Q1-Q2 2025 as investors waited for merger integration costs to clear. Today's reaction suggests confidence that the clean-quarter thesis is now playing out.
What Did Management Guide?
Management did not provide explicit EPS or revenue guidance but offered several forward-looking comments:
Positive signals:
- No material merger expenses expected going forward
- New Troy, MI branch planned for later in 2026 to drive growth in an attractive market
- $8M in estimated accretion income for 2026 from purchased loan marks, using effective interest method
- AI and automation investments underway to improve operational efficiency
Cautions:
- NIM pressure may persist: "With ChoiceOne's already low cost of deposits and market conditions, further reductions in federal funds rates may not immediately offset with savings"
- Interest rate swap exit: In January 2026, ChoiceOne exited $201M of pay-fixed swaps (3.4% coupon), leaving ~$180M at 2.88% weighted average coupon
CEO Kelly Potes: "As we move into 2026, we do so with strong organic growth momentum across our markets and a renewed focus on strengthening our customer relationships."
Key Metrics Deep Dive
Balance Sheet Scale-Up
The Fentura merger transformed ChoiceOne's balance sheet:
The merger added ~$1.8B in assets, $1.4B in loans, and $1.4B in deposits .
Profitability Metrics
The efficiency ratio improvement from 61.3% to 54.1% reflects merger synergies taking hold.
Asset Quality
Management emphasized that 0.63% of the 0.98% NPL ratio is attributable to purchased credit-deteriorated (PCD) loans that were identified before the merger — not emerging credit weakness .
Capital Position
Capital ratios declined YoY due to balance sheet growth but remain well above regulatory minimums. ChoiceOne Bank maintains "well-capitalized" status with a 12.5% total risk-based capital ratio .
Loan Portfolio Breakdown
CRE concentration is notable at 279% of total capital (non-owner occupied) , though this is common for community banks in Michigan.
Forward Catalysts
-
2026 accretion tailwind: $8M of scheduled interest income from purchased loan accretion provides earnings visibility
-
New Troy branch: Expansion into Southeast Michigan expected later in 2026
-
Tax credit purchases: Management is evaluating additional transferable tax credits to offset 2026 tax expense, following a $340K benefit in Q4
-
Operating leverage: With merger costs behind them, incremental revenue should flow more directly to the bottom line
Risks to Monitor
- NIM pressure: Continued Fed rate cuts may not immediately translate to deposit cost savings given already-low funding costs
- CRE concentration: 279% CRE-to-capital ratio warrants monitoring in a weakening commercial real estate environment
- NPL normalization: While management attributes the uptick to legacy PCD loans, the 0.98% NPL ratio bears watching
The Bottom Line
ChoiceOne delivered a clean beat in its first post-merger quarter without integration noise. The 94% YoY earnings growth reflects the scale benefits of the Fentura combination, while 7.6% annualized organic loan growth signals underlying franchise strength.
With merger expenses behind them and $8M in accretion income scheduled for 2026, the earnings profile looks more predictable. The key debate now shifts to NIM trajectory and whether organic growth can offset rate headwinds.
At $29.56 per share, COFS trades at roughly 1.0x tangible book value ($304M tangible equity / 15M shares = ~$20.29 TBV per share) — a reasonable multiple for a well-integrated community bank with mid-teens ROTCE.
Related Links: